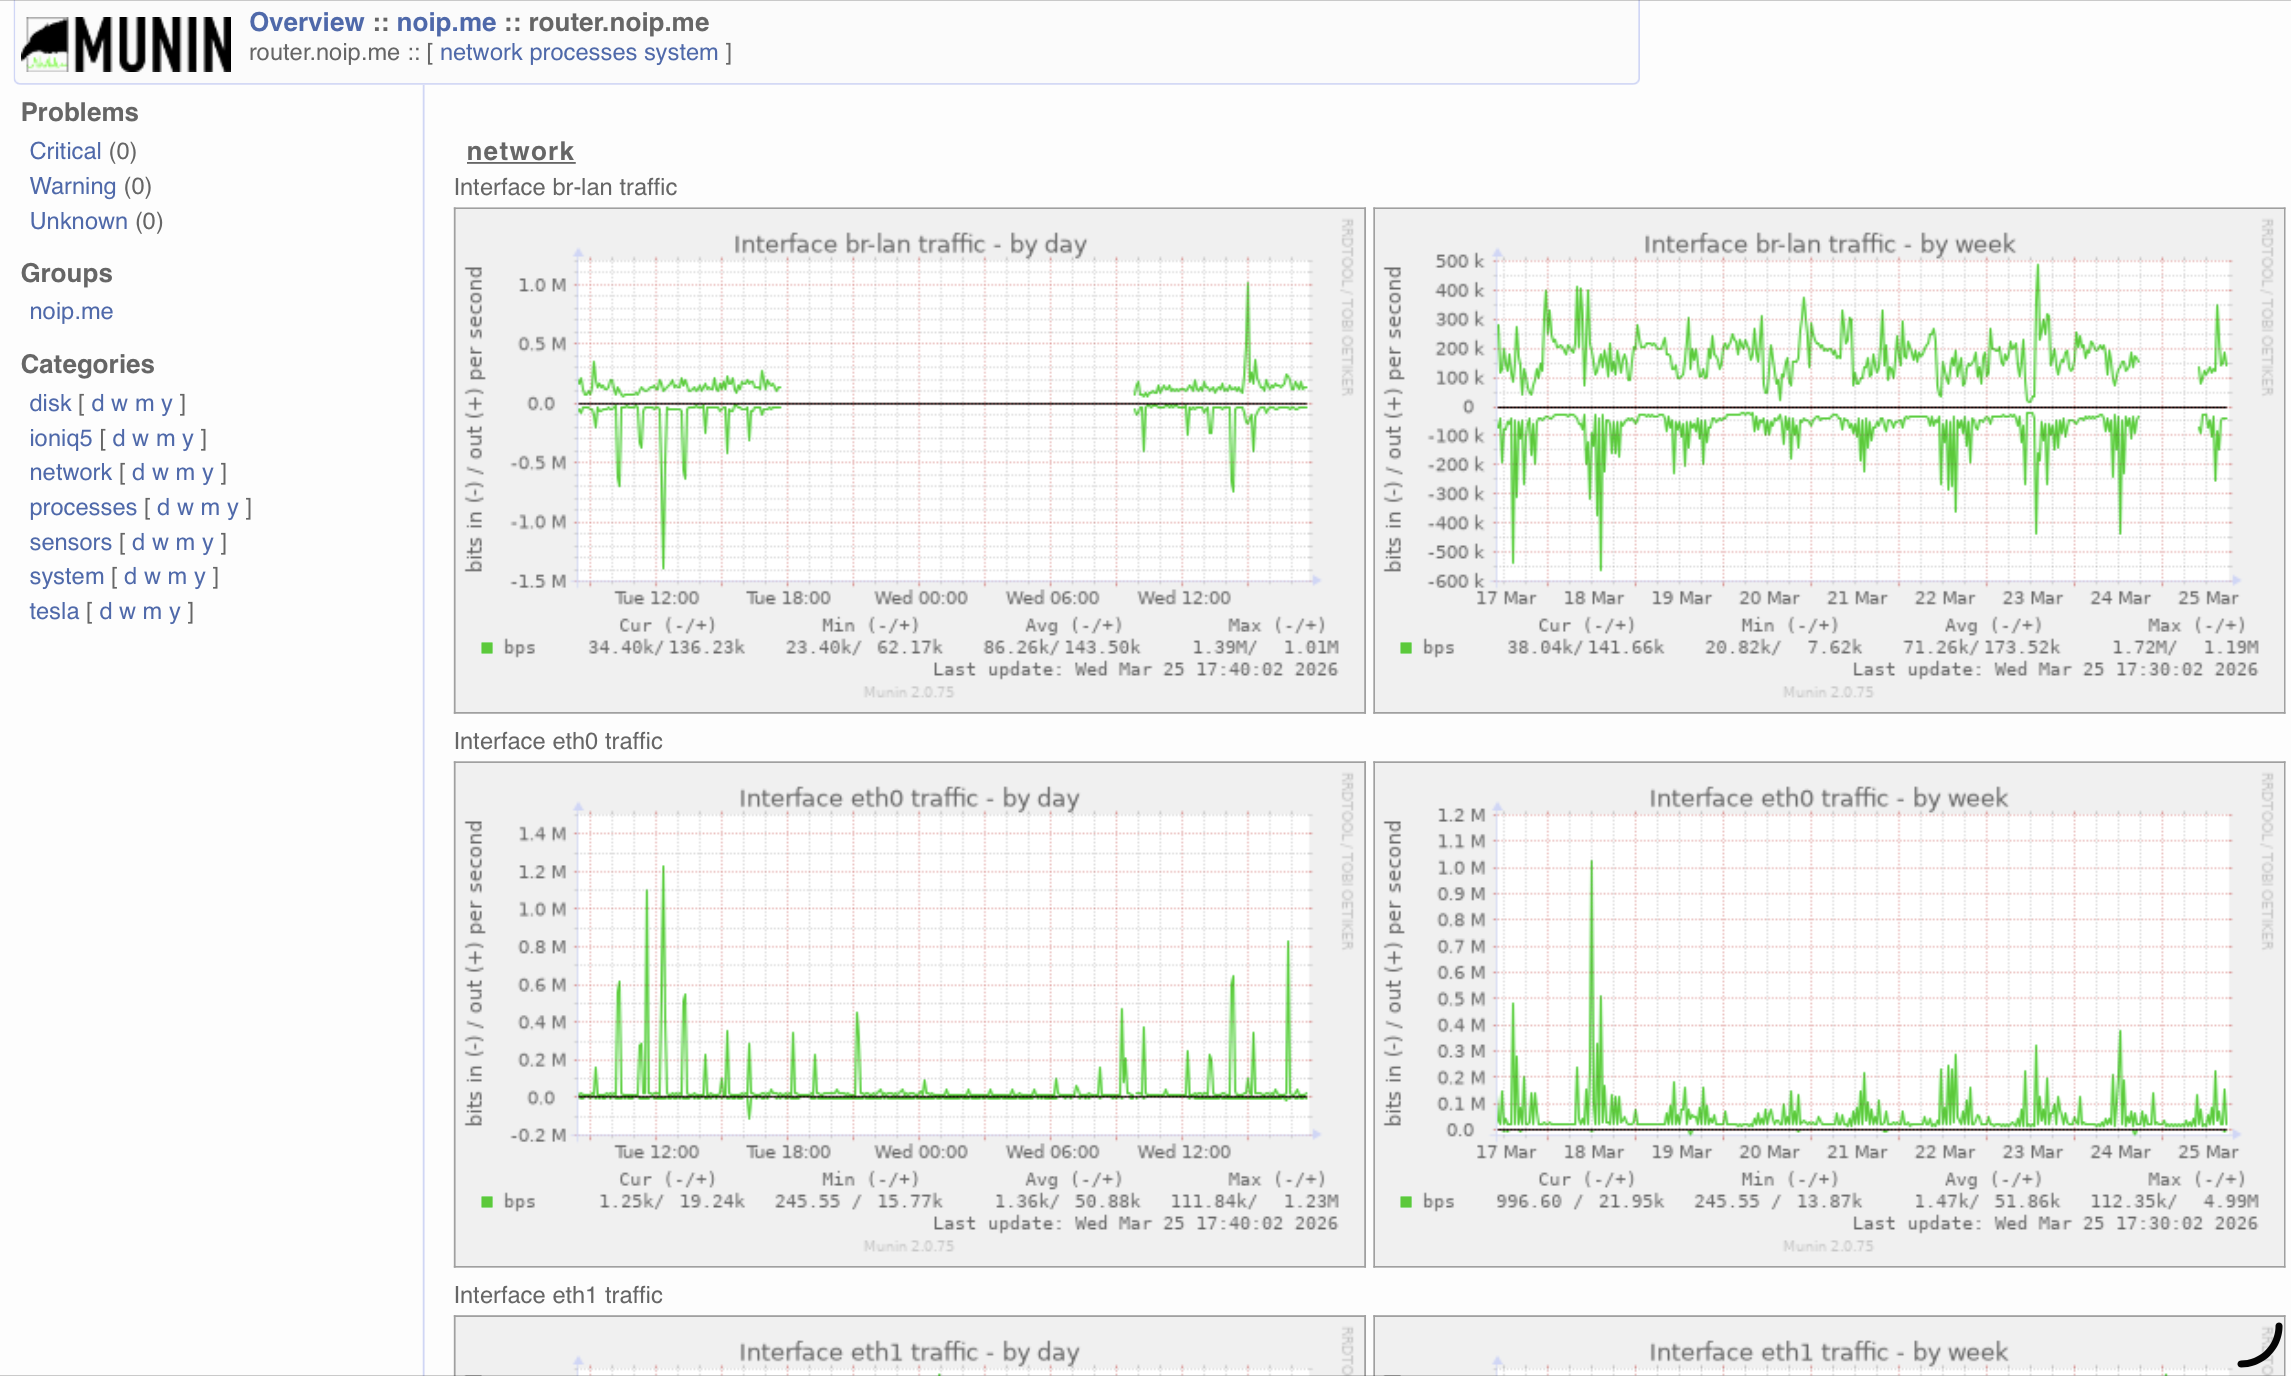
Author Archives: John

About John

I put the super in superuser.

Munin Monitor Tesla Powerwall/Solar info using local API

Who this is for:

Tesla Solar owners with Powerwalls, with the Powerwall on your local network on a known IP address (ie reserved IP via dhcp), and your munin software also running on your local network

Get Open Weather Map API key (for cloud cover)

Get a free api key if you want to include cloud cover Pct in the graph here 

Install Powerwall2PVOutput

See https://github.com/ekul135/Powerwall2PVOutput for install details. You’ll need to copy the code to your Munin plugin directory (/usr/share/munin/plugins) and edit PW_Config.py to have your local powerwall user, password, and local IP address.  See this page for info.

Munin Plugin code:
#!/usr/bin/env python3
import time
import sys
import datetime
import requests, json
import PW_Helper as hlp
import PW_Config as cfg


ssn = None

if (len(sys.argv) > 1):
  print('''graph_title Solar performance
graph_args -u 4000 -l -4000 -r --allow-shrink --right-axis-label 'battery/clouds pct' --right-axis 0.025:0
graph_vlabel kW
graph_category tesla
graph_info Solar, grid loads & battery %
batterypercent.label Battery Pct
batterypercent.info Battery charge in percent
batterypercent.colour 000000
batterypercent.draw LINE1
clouds.label Clouds Pct
clouds.info Cloud cover percent
clouds.colour 808080
clouds.draw LINE1
solar.label Panels
solar.info kW from panels
solar.colour ffa200
solar.draw AREA
houseload.label House
houseload.info kW to House
houseload.colour 00ffff
houseload.draw AREA
batterypower.label Battery
batterypower.info kW from/to battery (negative charging)
batterypower.colour 00ff00
batterypower.draw AREA
gridpower.label Grid
gridpower.info kW from/to grid (negative export)
gridpower.colour ff0000
gridpower.draw AREA
sbatterypercent.label scaled battery
sbatterypercent.colour 000000
sbatterypercent.draw LINE1
sbatterypercent.cdef batterypercent,40,*
sclouds.label scaled clouds
sclouds.colour 808080
sclouds.draw LINE1
sclouds.cdef clouds,40,*
''')
  exit(0)

try:
  url = requests.get("https://api.openweathermap.org/data/2.5/weather?units=imperial&lat=YOUR LAT&lon=-YOU LON&appid=YOUR APP ID")
  text = url.text
  weatherdata = json.loads(text)
  clouds = weatherdata['clouds']['all']

  ssn = hlp.getSession(cfg.PowerwallIP, cfg.PowerwallEmail, cfg.PowerwallPassword)

  pw=hlp.getPowerwallData(cfg.PowerwallIP, ssn)
  soc=hlp.getPowerwallSOCData(cfg.PowerwallIP, ssn)
  if (pw!=False and soc!=False):
    print('solar.value', float(pw['solar']['instant_power']))
    print('houseload.value', float(pw['load']['instant_power']))
    print('batterypower.value', float(pw['battery']['instant_power']))
    print('gridpower.value', float(pw['site']['instant_power']))
    print('batterypercent.value', float(soc['percentage']))
    print('clouds.value', float(clouds))
  except Exception as e:
    print('exception', e)
    print('solar.value', '0.0')
    print('houseload.value', '0.0')
    print('batterypower.value', '0.0')
    print('gridpower.value', '0.0')
    print('batterypercent.value', '0.0')
    print('clouds.value', clouds)

If all goes well, you’ll get fun graphs to watch, like these:


Monitoring Ioniq 5 / Kia EV6 EV SOC

If you happen to have
  • A Hyundai Ioniq 5 (or, Kia EV6, change brand below to “kia”)
  • An active Bluelink subscription
  • Munin monitoring set up somewhere
  • A need to monitor everything
  • Then this post is for you!
Note!

This is a bit hacky, apologies for not making it better

Prerequisites

Install bluelinky & configure it for your Bluelink & Car info on the box where you run munin

Create script to pull data points using bluelinky – this is the hacky bit. You can poll bluelink some number of times a day – the rate limits are not entirely clear. I’m pulling the cached values, so we’re not waking the car up each time and draining the 12v battery, which also means the data could be stale. Manually refresh via the mybluelink app…

Cron job script: /usr/local/etc/ioniq5.js (change the setting values below to match your info)

const BlueLinky = require("bluelinky");


const client = new BlueLinky({
  username: "YOUR USERNAME",
  password: "YOUR PASSWORD",
  pin: "YOUR PIN",
  brand: "hyundai",
  vin: "YOUR VIN",
  region: 'US', // 'US', 'EU', 'CA'
});

// called when the client logs in successfully
client.on("ready", async () => {
  const vehicle = client.getVehicle(vin);
  const response = await vehicle.status();
  console.log('{"soc": %d, "tvolt": %d}', response.evStatus.batteryStatus, response.battery.batSoc);
});

Add to your root crontab

*/10 * * * * node /usr/local/etc/ioniq5.js > /usr/local/etc/ioniq5.json

This polls the cached values 144 times a day – seems to be ok for rate limits at least in the US

The Munin plugin to consume and graph this data – /usr/share/munin/plugins/ioniq5 (and you need to install bluelinky in that folder as well for the cron script above to work correctly.)

#!/usr/bin/env python3
import sys
import os
import requests, json
import subprocess

if (len(sys.argv) > 1):
  print('''graph_title EV SOC
graph_args -u 100 -l 0
graph_vlabel battery pct
graph_category Ioniq5
graph_info Current SOC for EV
batt.label State Of Charge
batt.info SOC in percent
batt.draw LINE1
tvolt.info soc
tvolt.label 12V
tvolt.info SOC in percent
tvolt.draw LINE1
''')
  exit(0)

try:
  f = open('/usr/local/etc/siva.json')
  result = json.load(f)
  f.close()

  # parse & print
  print('batt.value', float(result['soc']))
  print('tvolt.value', float(result['tvolt']))

except Exception as e:
  print('exception', e)
  print('batterypercent.value', '0.0')

Symlink that to /etc/munin/plugins/ioniq5 and restart munin services, and you should get graphs like this

How old are those disks, anyway?

The day after the big heat wave, I woke to a dead home server. Not good. Fortunately things eventually recovered enough to bring everything back up, but that got me thinking about the actual age of the spinning rust (the drives) and the likelihood that the consumer/home grade drives were probably due for an upgrade.

Continue reading

If this then that.

This isn’t new. It’s just new to me. I’ve built similar systems myself based on this idea, but IFTTT has done a really nice job of integrating a slew of social media sites and tumblr_lx2dbqMTuy1qf10njsmart phone sensors (well, location anyway) to allow for really simple automation. Besides you just have to love any service where the About link points to a page named wtf.


Continue reading

Bad Robot

How do you make wordpress generate a robots.txt file? Or a sitemap?

Easy Peasy. You create and upload your own robots.txt file into the root directory of wordpress. I used this page for hints for a good wordpress robots.txt. That contains the Sitemap link, which you get from the XML Sitemap plugin. And then you kick google Webmaster tools until they show the right thing.

error-strip-dbb63fd118a5a7be2236f3474e7e65b8