Who this is for:
Tesla Solar owners with Powerwalls, with the Powerwall on your local network on a known IP address (ie reserved IP via dhcp), and your munin software also running on your local network
Get Open Weather Map API key (for cloud cover)
Get a free api key if you want to include cloud cover Pct in the graph here
Install Powerwall2PVOutput
See https://github.com/ekul135/Powerwall2PVOutput for install details. You’ll need to copy the code to your Munin plugin directory (/usr/share/munin/plugins) and edit PW_Config.py to have your local powerwall user, password, and local IP address. See this page for info.
Munin Plugin code:
#!/usr/bin/env python3
import time
import sys
import datetime
import requests, json
import PW_Helper as hlp
import PW_Config as cfg


ssn = None

if (len(sys.argv) > 1):
  print('''graph_title Solar performance
graph_args -u 4000 -l -4000 -r --allow-shrink --right-axis-label 'battery/clouds pct' --right-axis 0.025:0
graph_vlabel kW
graph_category tesla
graph_info Solar, grid loads & battery %
batterypercent.label Battery Pct
batterypercent.info Battery charge in percent
batterypercent.colour 000000
batterypercent.draw LINE1
clouds.label Clouds Pct
clouds.info Cloud cover percent
clouds.colour 808080
clouds.draw LINE1
solar.label Panels
solar.info kW from panels
solar.colour ffa200
solar.draw AREA
houseload.label House
houseload.info kW to House
houseload.colour 00ffff
houseload.draw AREA
batterypower.label Battery
batterypower.info kW from/to battery (negative charging)
batterypower.colour 00ff00
batterypower.draw AREA
gridpower.label Grid
gridpower.info kW from/to grid (negative export)
gridpower.colour ff0000
gridpower.draw AREA
sbatterypercent.label scaled battery
sbatterypercent.colour 000000
sbatterypercent.draw LINE1
sbatterypercent.cdef batterypercent,40,*
sclouds.label scaled clouds
sclouds.colour 808080
sclouds.draw LINE1
sclouds.cdef clouds,40,*
''')
  exit(0)

try:
  url = requests.get("https://api.openweathermap.org/data/2.5/weather?units=imperial&lat=YOUR LAT&lon=-YOU LON&appid=YOUR APP ID")
  text = url.text
  weatherdata = json.loads(text)
  clouds = weatherdata['clouds']['all']

  ssn = hlp.getSession(cfg.PowerwallIP, cfg.PowerwallEmail, cfg.PowerwallPassword)

  pw=hlp.getPowerwallData(cfg.PowerwallIP, ssn)
  soc=hlp.getPowerwallSOCData(cfg.PowerwallIP, ssn)
  if (pw!=False and soc!=False):
    print('solar.value', float(pw['solar']['instant_power']))
    print('houseload.value', float(pw['load']['instant_power']))
    print('batterypower.value', float(pw['battery']['instant_power']))
    print('gridpower.value', float(pw['site']['instant_power']))
    print('batterypercent.value', float(soc['percentage']))
    print('clouds.value', float(clouds))
  except Exception as e:
    print('exception', e)
    print('solar.value', '0.0')
    print('houseload.value', '0.0')
    print('batterypower.value', '0.0')
    print('gridpower.value', '0.0')
    print('batterypercent.value', '0.0')
    print('clouds.value', clouds)
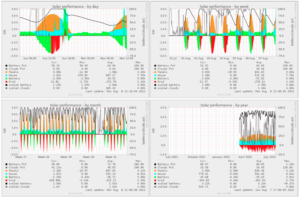
If all goes well, you’ll get fun graphs to watch, like these: