If you happen to have
- A Hyundai Ioniq 5 (or, Kia EV6, change brand below to “kia”)
- An active Bluelink subscription
- Munin monitoring set up somewhere
- A need to monitor everything
- Then this post is for you!
Note!
This is a bit hacky, apologies for not making it better
Prerequisites
Install bluelinky & configure it for your Bluelink & Car info on the box where you run munin
Create script to pull data points using bluelinky – this is the hacky bit. You can poll bluelink some number of times a day – the rate limits are not entirely clear. I’m pulling the cached values, so we’re not waking the car up each time and draining the 12v battery, which also means the data could be stale. Manually refresh via the mybluelink app…
Cron job script: /usr/local/etc/ioniq5.js (change the setting values below to match your info)
const BlueLinky = require("bluelinky");


const client = new BlueLinky({
  username: "YOUR USERNAME",
  password: "YOUR PASSWORD",
  pin: "YOUR PIN",
  brand: "hyundai",
  vin: "YOUR VIN",
  region: 'US', // 'US', 'EU', 'CA'
});

// called when the client logs in successfully
client.on("ready", async () => {
  const vehicle = client.getVehicle(vin);
  const response = await vehicle.status();
  console.log('{"soc": %d, "tvolt": %d}', response.evStatus.batteryStatus, response.battery.batSoc);
});
Add to your root crontab
*/10 * * * * node /usr/local/etc/ioniq5.js > /usr/local/etc/ioniq5.json
This polls the cached values 144 times a day – seems to be ok for rate limits at least in the US
The Munin plugin to consume and graph this data – /usr/share/munin/plugins/ioniq5 (and you need to install bluelinky in that folder as well for the cron script above to work correctly.)
#!/usr/bin/env python3
import sys
import os
import requests, json
import subprocess

if (len(sys.argv) > 1):
  print('''graph_title EV SOC
graph_args -u 100 -l 0
graph_vlabel battery pct
graph_category Ioniq5
graph_info Current SOC for EV
batt.label State Of Charge
batt.info SOC in percent
batt.draw LINE1
tvolt.info soc
tvolt.label 12V
tvolt.info SOC in percent
tvolt.draw LINE1
''')
  exit(0)

try:
  f = open('/usr/local/etc/siva.json')
  result = json.load(f)
  f.close()

  # parse & print
  print('batt.value', float(result['soc']))
  print('tvolt.value', float(result['tvolt']))

except Exception as e:
  print('exception', e)
  print('batterypercent.value', '0.0')
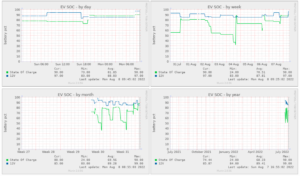
Symlink that to /etc/munin/plugins/ioniq5 and restart munin services, and you should get graphs like this
